T. A. Holliday, DVM, PhD; Colette Williams, BS
Veterinary Medical Teaching Hospital and Department of Surgical and Radiological Sciences, School of Veterinary Medicine, University of California-Davis, Davis, CA
Abstract: This paper briefly reviews the physiological basis of the electroencephalogram, and describes technique and equipment, artifacts, normal background rhythms and normal transient events in awake and sleeping dogs.
Introduction
If two electrodes are placed on the skin over the calvaria and connected to a recording system, a constantly varying difference in potential between the electrodes is recorded. The electrical activity stops after death, hence is dependent on living tissue. Since it is dependent on living tissue, it is dependent on cellular activity. Neurons were known to be the most electrically active cells in the head, therefore early workers considered them to be the most likely source of this activity, which came to be known as the electroencephalogram (EEG). Subsequent study has shown the accuracy of this view.
Electroencephalography has come to be a useful diagnostic aid in known or suspected cerebral disorders. In human medicine, it has been of special value in under-standing the pathophysiology of seizure disorders and it has become a valuable diagnostic aid in patients with histories of seizures. Its use was first reported in veterinary medicine over 30 years ago and since then EEG characteristics of a variety of diseases have been reported.1-8 From the onset, the EEG has been interpreted by simple visual inspection. With the advent of automated quantitative computer analysis, EEG is now finding valuable applications in veterinary and human medicine in monitoring anesthetized or critical-care patients which have cerebral cortex damage or are at risk for it.9-11 Here, we review the physiological basis of the EEG, and describe technique, equipment, artifacts, normal background rhythms and normal transient events in awake and sleeping dogs. EEG samples shown are from the collection in the clinical EEG laboratory of the Veterinary Medical Teaching Hospital of the School of Veterinary Medicine, University of California Davis (UCD-VMTH). Wherever possible, terminology used follows internationally accepted recommendations.20
Physiological Basis of the Electroencephalogram
The EEG is a record of the spontaneous electrical activity of the cerebral cortex; no stimulation is necessary to record it. The potentials recorded at the surface vary in polarity in a somewhat rhythmical fashion. Considering that a very wide range of frequencies is conceivable, it is notable that the fluctuations are confined to a relatively narrow range, about 0.5 Hz to 50 Hz, with most well below 30 Hz. Amplitude of the individual waves recorded by surface electrodes varies from a few to several hundred microvolts, usually remaining below 100 FV.
Sources of the EEG
The physical characteristics of the tissues and electrodes indicate EEG activity reaching a surface electrode arises from superficial parts of the cerebral cortex having a depth of about 5 mm and a surface diameter of 1-2 cm.12 Only the cerebral cortex is represented in the EEG, other parts of the brain may influence it indirectly but do not contribute to the voltages recorded. Understanding the EEG requires understanding the sources of the electrical activity in the cortex and the reasons for the constant, rhythmical oscillations in polarity and amplitude.
All-or-none action potentials in axons do not contribute significantly to the ongoing activity of the EEG. Cortical axons course in many directions relative to the surface, therefore the net effect of their action potentials on surface electrodes is zero. This contrasts with evoked potentials, where all-or-none action potentials can contribute to the recordings because the stimulus evokes synchronous activity in a large number of axons at once.13
Instead, the EEG arises from two sources: 1. synaptic activity of cortical neurons; 2. changes in membrane potentials of glial cells. Studies correlating surface events and intracellular events in cortical neurons show a direct relationship of post-synaptic potentials (PSPs) and surface potentials.13 The release of neurotransmitter at a synapse allows selective movements of ions through the postsynaptic membrane. These transmembrane currents result in local changes in ionic concentrations, both intracellularly and extracellularly. This results in the formation of dipoles. A dipole consists of a separation of positive and negative charges, in this case, a transient redistribution of positive and negative charges in the medium. Extracellular and intracellular ionic currents flow between the dipoles because both the intracellular and extracellular media are excellent conductors. The extracellular currents give rise to the surface recorded EEG.13
It is important to note that EEG potentials are field potentials, i.e., they are dipoles which form and dissipate at fixed points, behaving in an "on-off" fashion, much as an electric light being turned on, then off. Thus they contrast with nerve or muscle action potentials in which small electrically active areas of axons or muscle fibers move toward, pass by and move away from the recording electrodes, e.g., when nerve conduction velocities are measured.14
The pyramidal cells of the cerebral cortex are probably the most important neuronal source of the EEG. Their dendrites are long and arranged in parallel, thus PSPs can occur in one part of a cell while other, relatively remote parts are quiescent; the dipoles so formed cause currents to flow which will have a greater effect on a surface electrode than those of smaller cells, e.g., granular cells, which have small dendritic trees arranged radially around cell bodies and produce small dipoles that have little effect on a surface elec-trode.13 Studies in the cat indicate that potentials originating on the surfaces of the gyri oriented parallel to the skull have maximal effects on surface electrodes, whereas those arising in the depths of the convolutions have minimal effects. Intermediate sources have intermediate effects.16
The glial cell contribution to the EEG results from potential changes in cortical neurons which cause transient changes in extracellular K+ ; these in turn produce passive depolarizations in membrane potentials of glial cells. Glial cells have close electrical coupling and this may allow them to spread the potentials to other glial cells, amplifying those initiated by neurons and thus contributing to the DC potentials (see below).15 Conversely, the glial cell potentials must also have reciprocal effects on nearby neurons.
Polarity and Amplitude of EEG Waves
The apparent polarity of a PSP recorded by a surface electrode depends on whether it is an excitatory or inhibitory PSP (EPSP or IPSP). When EPSPs occur near a surface electrode, they cause negativity of the tissue near the electrode, relative to a remote electrode; IPSPs cause the opposite effect (Figure 1). When EPSPs occur in deeper sites, for example near the cell bodies of pyramidal cells, a surface electrode will register a positive deflection; again, IPSPs have the opposite effect (Figure 1).
Click on the image to see a larger view
| Figure 1. | 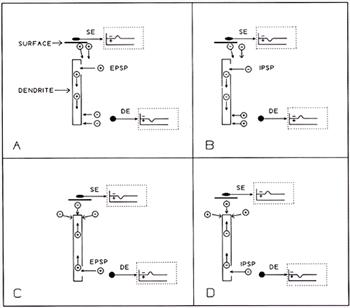
Effects on surface and depth electrodes of superficial and deep dendritic events, as in cortical pyramidal cells.
In the resting state, ions are distributed evenly in intracellular or extracellular spaces. The reference electrode (not shown) is remote, therefore not appreciably affected by synaptic events.
A. When an EPSP occurs near the surface, + ions move into the intracellular space. The resulting negativity in the local extracellular space attracts positive ions from surrounding regions, including superficial areas, therefore the surface electrode (SE) registers negativity (inset within dotted lines). Positive ions moving into the intracellular space initiate local current flows there; the increased intracellular positivity thus attracts negative ions toward the cell membrane due to its capacitance; this causes the depth electrode (DE) to register positivity (inset within dotted lines). B. An IPSP occurring in superficial dendrites causes events analogous to those in A., but having opposite polarities. C. An EPSP occurring in deep dendrites (or at the somata), results in negativity at a depth electrode and positivity at the surface. D. An IPSP in deep dendrites or at the somata results in events analogous to C. but having opposite polarities. |
|
| |
Individual PSPs are too small to be detected by surface electrodes. However, there may be as many as 40,000 synapses on a single pyramidal cell, thus there are hundreds of thousands, or even millions, of synapses within the recording range of a surface electrode. If PSPs occurred at all these synapses randomly, that is, totally asynchronously, the net effect on the potential of a surface electrode would be zero. However, the presence of rhythmic activity at the surface indicates there is a degree of synchrony among synapses, creating overlapping of dipoles in space and in time and resulting in the summation of many individual potentials to levels that are detectable with surface electrodes. PSPs arise only as a result of presynaptic activity; the postsynaptic synchrony probably results mainly from synchrony of impulses arriving on presynaptic fibers. The slow potentials of the glial cells also affect the rhythms of the EEG.13
The rhythms of the EEG are explained by a model in which afferent action potentials arrive in somewhat synchronous volleys at presynaptic terminals within a given area; activity in other similar areas is not necessarily synchronous therefore recordings made from different parts of the scalp differ in appearance. Short volleys arriving in a given area initiate PSPs which overlap in time and appear at the surface as EEG waves of corresponding duration and frequency. Longer volleys elicit longer PSPs and slower waves. However, very long events are not recorded by routine clinical methods, because capacitance-coupled ("AC") amplifiers are used. Instead, after a period determined by the time constant of the amplifier, usually less than 1 second, the tracing recorded at the surface returns to or near 0 V. If a direct-coupled (DC) amplifier is used, this very slow EEG activity can be detected; however, technical difficulties preclude this for routine clinical applications.13
Thus, the potentials recorded at the surface are the algebraic sum of somewhat synchronous contributions by neuronal synapses, which change rapidly and in either direction, positive or negative, and glial cells, which operate slowly and show only depolarization, producing a smoothing, integrating effect on the EEG.13
Electroencephalographic Technique and Equipment
Sedation and Anesthesia
The EEG of dogs has been recorded clinically without premedication,6 with sedation (tranquilization),4, 17 and under general anesthesia.5, 18 Artifacts caused by movements of the patient and by muscles in the region of the recording electrodes are a serious problem in non-sedated patients and can obscure the recording to the point where it is of little value. Also, many dogs that are not sedated remain fully aroused thus preventing recording during the various stages of sleep, which are important indicators of the health of the brain. Some EEG abnormalities, for example focal spikes, can be recorded from patients during general anesthesia;5,18 however, some general anesthetics induce spikes and thus can confuse interpretation.19 Importantly, general anesthesia also prevents recording during physiological sleep. Sedative drugs, in doses just sufficient to render the animal drowsy when undisturbed, minimize or eliminate difficulties with movement and muscle artifacts and permit recording during all states of vigilance (see below). Sedation is used when necessary in restless patients or to induce sleep in human EEG patients and is not considered to detract from the value of the recordings obtained.20
In the clinical neurophysiology laboratory of the UCD-VMTH, light sedation is used, as follows: 15 minutes prior to placing the recording electrodes, dogs are given 5 mg/kg meperidine (IM or SC); 5 minutes prior to placing electrodes, 0.1 mg/kg acepromazine is administered IV (in a few instances only meperidine is given and in a few others, no sedation is administered. No physical restraint is used. Electrode placement requires 5-7 minutes; recording begins immediately thereafter and is completed in 25-50 minutes in most cases. Recording is performed in a dimly lit room which has sound-attenuating walls. During recording, most dogs become drowsy and sleep, frequently passing through all physiological stages of sleep and showing normal physiological transients; nevertheless, at the end of recording they are readily aroused and can walk unassisted. In a few dogs, 0.2% lidocaine is injected subcutaneously around electrodes where persistent muscle artifacts occur (~1.0 ml/electrode); also in dogs where it is indicated for medical reasons, atropine (0.4 mg/kg, SC) is given prior to or during EEG recording. In the doses used, none of the drugs administered is known to elicit EEG abnormalities in normal dogs.
Definitions: Polygraphs, Electrodes, Derivations and Montages
Polygraphs
A polygraph consists of: inputs (connectors) for multiple electrodes. The electrodes are in electrical contact with the head and are connected to amplifiers in the polygraph which then amplify the voltages from the electrodes. These voltages are led to pen writers in the polygraph which make permanent paper copies of the recorded activity. Some polygraphs use heat-writing styluses rather than pen writers; there appear to be no distinct advantages of one over the other. Many polygraphs provide connections that permit leading the EEG signals into an oscilloscope for instantaneous display and/or into a computer or magnetic tape recorder, where they can be analyzed and/or stored.
Electrodes
To record the EEG, small needle electrodes (e.g. Grass Instrument Co. platinum alloy subdermal electrodes) are placed in the subcutaneous tissues over the calvaria. Alternatively, small metal disk electrodes (Grass) can be applied to the skin surface or small alligator clamps can be attached to the skin after dulling the teeth of the clamp.
Derivations
Two electrodes are connected to each amplifier of the polygraph; the electrodes and the recording obtained therefrom are termed a "derivation". As noted earlier, each electrode records effectively from only a small area of the brain underlying it, therefore multiple derivations must be used to detect differences between brain regions. A pair of electrodes, the amplifier to which they are connected, the pen driver which records the amplifier output, and/or the resulting recording are also referred to often as a "channel".
Montages
A "montage" is the aggregate of derivations recorded at any one time. Ideally, if a sufficient number of amplifiers were available on the polygraph, a single montage could be devised that would permit recording from all areas of both cerebral cortices simultaneously. In most veterinary EEG laboratories the number of amplifiers is limited, therefore it is helpful to devise several montages so that recordings can be made from the entire dorsolateral area of each cortex. The ventral and ventrolateral cortical areas are inaccessible to routine recordings. Derivations formed from electrodes placed ventral to the cerebrum in the nasopharynx, or ventrolateral, adjacent to the sphenoid bone (via the orbit) exist but have not yet received common use in veterinary clinical patients.
Polarity Considerations and Conventions in Devising Derivations and Montages
The two electrodes within a derivation are referred to by various names designating their relationship to one another. Formerly, it was common to refer to one as the "active" electrode and the other as the "reference" electrode even though it was acknowledged that both were "active", i.e., recording electrical activity. Also, since the electrodes were connected to two of the grids in a vacuum tube ("valve"), they were often referred to as "G-1" and "G-2". Preferred terminology now refers to one electrode as the "exploring" electrode and the other as the "reference" electrode.20
The input electrodes are sometimes referred to as the "+" and "-" electrodes. This designation should be discouraged because it obscures the fact that electrically (i.e., with respect to ground potential), at any given time, both electrodes may be positive or both may be negative, or one may be positive and the other negative.
By international convention, EEG electrodes should be connected to the amplifier so that if the first-named electrode of a pair becomes negative with respect to the second, the pen will move upward on the paper. Conversely, negativity of the second electrode of the pair, with respect to the first, will cause a downward pen movement. Positivity causes movements in the reverse directions.20
Note that both electrodes can be positive or negative with respect to any other place in the universe, it is the polarity of the electrodes relative to one another that determines the direction of pen movement, a fact that must not be forgotten in EEG interpretation.21, 22
Montages should be designed to permit optimal accuracy and ease in identifying generalized and focal EEG events. Two types are used, "bipolar" montages and "common reference" montages; the latter are sometimes referred to simply as "reference montages".20 Actually, both types use reference electrodes, since it is impossible to record anything unless electrodes are connected to both inputs of the amplifier. (This completes the electrical circuit, which allows the current to pass through one electrode, the amplifier, the second electrode and then through the tissue, returning to the first electrode.) It is considered incorrect to refer to common reference montages as "monopolar" montages.20
In bipolar montages, derivations are formed by two electrodes that are acknowledged to be located over active cerebral tissue. It is recommended that the electrodes be connected to form chains oriented longitudinally and/or transversely over the calvaria. Each electrode should appear in two adjacent channels, once as the "exploring" and once as the "reference" electrode.20 When so arranged, a negative event most affecting a given electrode causes an upward deflection of the pen in the channel where it is the exploring electrode and a downward deflection in a channel where it is the reference electrode. This causes the pens in adjacent channels to move in opposite directions, an event which is conspicuous and very helpful in localizing focal events during interpretation. (Figure 2) The reversal of direction is correctly referred to as an "instrumental phase reversal".20 It is sometimes termed "phase reversal" although this is a grossly erroneous term: the event does not actually reverse its phase (polarity), but simply appears that way as a result of the way the electrodes are connected to the amplifier!
|
|
Figure 2. "Instrumental phase reversal". Using internationally recommended conventions for connecting electrodes to amplifiers and for displaying recordings, a hypothetical spike causing electrode B to become more negative than electrodes A or C will cause a downward deflection in channel A-B and an upward deflection in B-C. Instrumental phase reversal is helpful in identifying the location of EEG events. Note that, all three electrodes may be either positive or negative with respect to "ground" potential, all that matters is their polarity with respect to one another. For example, in this case, with respect to ground, electrode A could be +30 v, electrode B could be +10 V and electrode C could be +30 v. |
In reference montages, one electrode is used as a reference electrode in all derivations, the other electrode of each derivation is placed somewhere else over the brain. Ideally, the reference electrode would be placed on an electrically inactive site; however, no such site exists. Furthermore, the farther the reference electrode is from the active electrode, the more troublesome do artifacts become, for example, the electrocardiogram. Therefore, the reference electrode is usually placed on the head where in fact it is as active as any of the other electrodes. Importantly, in a reference montage, focal events do not show instrumental phase reversal; they can be located only by differences in amplitude. Similarly, background rhythms show differences in amplitude that are related only to the distance between the reference electrode and the active electrodes.23
Electrode placements used for dogs in the UCD-VMTH are shown (Figure 3). Montages used include both bipolar and referential types and combinations of both (Tables 1, 2 below; or in easily printed form).
|
|
Figure 3. Diagrams showing the standard locations of electrodes used for recording canine EEG at the Veterinary Medical Teaching Hospital of the University of California Davis. L: left; R: right; S: located on dorsal midline over frontal sinus; F: frontal; C: central; P: parietal; O: occipital; V: vertex (dorsal midline); T: temporal (located immediately rostral to the external ear canal, just above the level of the zygomatic arch). For very small dogs, the arrangement shown in the right figure is used. |
Table 1. Routine electroencephalographic electrode montages used prior to 1985 in the clinical neurophysiology laboratory of the Veterinary Medical Teaching Hospital, University of California Davis.
See also, Table 2. Locations of electrodes on the head are shown in Figure 3.
|
CHANNNEL |
PATTERN A |
PATTERN B |
PATTERN C* |
PATTERN D* |
|
1. |
RF-RC |
RT-RC |
RF-S |
RT-S |
|
2. |
RC-RP |
RC-CV |
RC-S |
RC-S |
|
3. |
RP-RO |
CV-LC |
RP-S |
CV-S |
|
4. |
FV-CV |
LC-LT |
RO-S |
LC-S |
|
5. |
CV-PV |
RF-RP |
LF-S |
LT-S |
|
6. |
LF-LC |
FV-CV |
LC-S |
RP-RF |
|
7. |
LC-LP |
CV-PV |
LP-S |
PV-FV |
|
8. |
LP-LO |
LF-LP |
LO-S |
LP-LF |
|
* If electrode S is "active", an additional recording is made using the PV electrode as reference. |
Table 2. Routine electroencephalographic electrode montages used since 1985 in the clinical neurophysiology laboratory of the Veterinary Medical Teaching Hospital, University of California Davis.
See also, Table 1. Locations of electrodes on the head are shown in Figure 3.
|
CHANNEL |
MONTAGE 1 |
MONTAGE 2 |
MONTAGE 3* |
MONTAGE 4* |
|
1. |
LF-LC |
LF-FV |
LF-S |
LT-S |
|
2. |
LC-LP |
FV-RF |
LC-S |
LC-S |
|
3. |
FV-CV |
LT-LC |
LP-S |
CV-S |
|
4. |
CV-PV |
LC-CV |
LT-S |
RC-S |
|
5 . |
RF-RC |
CV-RC |
RF-S |
RT-S |
|
6. |
RC-RP |
RC-RT |
RC-S |
LP-LF |
|
7. |
LC-CV |
LP-PV |
RP-S |
PV-FV |
|
8. |
CV-RC |
PV-RP |
RT-S |
RP-RF |
|
* If electrode S is "active", an additional recording is made using the PV electrode as reference. |
Amplifiers
It is imperative to recognize that in EEG, as in all clinical neurophysiology, only differential amplifiers are used. Differential amplifiers amplify the difference in voltages of the input electrodes and it is the magnitude of that difference and the degree of amplification by the amplifier that determines how far the pen moves. As noted above, the direction of pen movement (up or down on the page) is determined by the polarity of the electrodes relative to one another.
Amplifiers should have maximum sensitivity in the frequency range of the EEG. A range of 0.5 to ~70 Hz is sufficient.20 Some EEG amplifiers have a much higher high-frequency limit but this is not used effectively, since the highest frequencies that can be recorded are limited to about 75-90 Hz by the inertia of the pens and pen drivers.
Additional Helpful Technics
As an aid in recognition of artifacts associated with eye movements, it is very helpful to record the electro-oculogram (EOG). This can be done by placing a pair of electrodes adjacent to the lateral canthus of each eye or near the medial and lateral canthus of one eye and connecting them to one channel of the polygraph. These electrodes are sensitive to nystagmus.
If the polygraph has enough recording channels, it is helpful to use one channel for recording the electrocardiogram, as ECG artifact often appears in the EEG and can be confused with paroxysmal discharges such as epileptic spikes.
Physiological and pharmacological activation technics are helpful in eliciting EEG abnormalities in epileptic animals. Sleep is the most effective practicable activating agent in epileptic dogs (personal observation). Photic stimulation, in the form of a bright, flickering light, also may be used, alone or in combination with chlorpromazine, to elicit abnormalities in the EEG of dogs.4,17 Hyperventilation, commonly used to elicit abnormality in human EEG patients, cannot be used conveniently in clinical veterinary EEG.
A single dose of chlorpromazine IV (2.2 mg/kg) was shown to enhance the probability of recording paroxysmal discharges (PD) from epileptic dogs.4 It does not cause PD in normal dogs, although long-term administration of phenothiazines was reported to cause PD in the EEG of human psychiatric patients.24 Convulsant drugs have been used as activating or "provocative" agents experimentally and in human EEG patients;25 however difficulties in controlling the effects make them of limited appeal for clinical use in animals.
Interpretation of the Electroencephalogram
There are two methods of EEG interpretation: simple visual inspection and automated, computerized analysis. Simple visual inspection is the traditional method. It requires study, training and experience, yet this is worthwhile because it provides better overall understanding of the patient and of disease processes. For that reason, it is considered in more detail here, than is automated analysis.
Automated EEG Analysis
Automated EEG analysis cannot be fully understood without an understanding of the nature and physiology of conventional EEG. Without this background, automated analysis becomes merely a cookbook procedure. Automated EEG analysis provides a readily obtained quantitative expression of the "amounts" of various frequencies that comprise EEG recordings. The equipment records the EEG from one or more channels, at intervals takes sample periods (e.g., 5 sec) from each channel, performs a frequency or interval analysis, and provides a graph of the analysis almost instantaneously. By stacking up graphs of successive periods, it provides a concise, visual record of the EEG frequency changes over time (Figure 4).27 Some equipment is capable of storing the data in numerical form for statistical analysis. automated EEG analysis can be used for monitor-ing surgical patients for depth of anesthesia, cerebral hypoxia or ischemia, for monitoring critical care patients in coma or metabolic encephalopathy, and for diagnosis of certain clinical patients or experimental animals. The data is simply a quantitative expression of the BGR; important qualitative events such as artifacts or PD can be hidden by automated analysis (Figure 4). Very sophisticated computer programs can identify, mark and count PD but must be carefully managed to avoid errors.28
Click on the image to see a larger view
| Figure 4. | 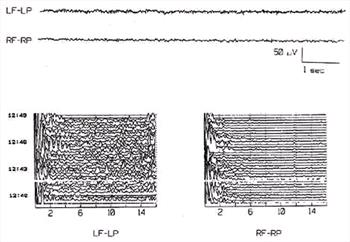
The upper part of this figure shows two channels of the conventional EEG of a dog and the lower part shows compressed spectral arrays from the same channels. The CSA analysis included frequencies from 0.1 to 16 Hz. In the CSA, time of day is shown at left and EEG frequencies at bottom. The EEG segments shown were recorded at 12:44. Each single trace of the CSA was calculated from a 16 second segment of EEG. CSA calculations were suspended during the blank region at about 12:41.5 while a brainstem auditory evoked potential was recorded (not shown). The LP-LF CSA shows more activity in the 5-16 Hz range than is evident in the CSA of the RP-RF derivation. This could have occurred because the LP-LF derivation is heavily contaminated with muscle artifact, which caused the numerous small spikes that are obvious in the conventional EEG. In this example, the apparent asymmetry of background rhythms between the hemispheres may be artifactual. |
|
| |
Interpretation of the EEG by Visual Inspection
The ongoing, continuous voltage changes which comprise the EEG consist of background rhythms (BGR) and transient events; these characteristics can be focal, multlifocal or generalized.
Background Rhythms
Background rhythms have both frequency and amplitude. Frequency is defined as the number of times per second the voltage changes in the negative or positive directions. Note that this is not necessarily "zero crossings" but simply change in direction of any (predetermined) amplitude. The units of frequency are "Hertz" (Hz); the less-desirable terms "cycles per second" or simply "per second" were used earlier and are still used occasionally. Amplitude refers to the magnitude of the changes in voltage, measured from peak negativity to peak positivity or vice versa, and is most frequently expressed in microvolts.
Background rhythms of mature dogs stay within relatively narrow limits (about 0.5/sec to 30/sec).26 They consist of a dominant frequency, usually with smaller amounts of other frequencies superimposed thereon. In general, lower frequencies are accompanied by higher amplitudes and vice versa.
Transient Events
Transient events are events that occur for brief periods, usually only a few seconds or less in duration. They consist of some form of EEG activity, which is distinct from and is superimposed on or replaces the background rhythms. There are both normal and abnormal transient events. Importantly, many artifacts are transient and must be distinguished from true EEG transients. Paroxysmal discharges (PD) are abnormal transient events that are associated with seizure disorders, ictally or interictally.
Regardless of the mode of interpretation, before an EEG recorded from a patient can be accurately and reliably interpreted, the interpreter must learn to recognize EEG artifacts, normal states of consciousness (arousal, drowsiness and sleep), and normal transient events.
Artifacts
With experience, many artifacts can be recognized readily during interpretation; however it is very helpful if the person performing the EEG makes notes on the record about movements or other events observed during recording. The most frequent artifacts encountered are those associated with muscle potentials, head, limb or body movements, the ECG and respiration. Less often, swallowing or mandibular movements cause artifacts. (The artifacts discussed below are illustrated in figures selected for the purpose and also are labeled in figures chosen for other purposes in order to illustrate some of the variation in appearances.) Sources of artifact in the equipment and environment have been describe previously and will not be discussed here.29
Muscle Artifact
Muscle potentials are the most common and often the most troublesome artifacts. They arise from the facial or masticatory muscles and cause intermittent or continuous relatively high frequency activity that can partially or completely obscure BGR (Figure 5). Muscle potentials often disappear or subside during the first 3-5 minutes of the recording period if sedative drugs are used. If persistent, subcutaneous injection of 1-3 ml 0.2 % lidocaine around the offending electrodes usually reduces or eliminates the problem. At times it is helpful to reduce the high frequency limit of the amplifiers; however, this can alter the configuration of rapid EEG events such as epileptic spikes, therefore it should be done only if absolutely necessary and only by recording for a period using the standard frequency band width.
Click on the image to see a larger view
| Figure 5. | 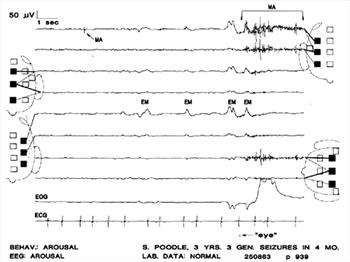
Muscle artifact (MA) in all EEG channels within bracketed time as well as elsewhere. Eye movements are evident in the electro-oculogram (EOG) and in the EEG channels, where they are synchronous with the deflections in the EOG. The tiny mark to the left of the word "eye" was made by the electroencephalographer to note the approximate time an eye movement was observed. The behavioral state of the dog was judged to be that of arousal and the EEG background rhythms (BGR) are those of full arousal in a normal dog.Solid squares represent electrode sites in use; dotted-line squares represent electrode sites not used in the montage. In each derivation, the solid line connects the exploring electrode and the dotted line connects the reference electrode to the EEG channel displaying the output. Lowermost channel is the electrocardiogram (ECG). The case number and the page of the EEG that is reproduced appear in the lower right. |
|
| |
Movement Artifacts
Movements of the body or its parts can induce artifacts (Figure 6). The most common of these are associated with movements of the head or other body parts, and respiratory movements. These artifacts probably arise from movements that cause the electrodes or their connecting wires to move through the ambient electromagnetic fields in the laboratory (personal observation). Eye movements cause artifacts by this means and also by a very different mechanism (below).
Click on the image to see a larger view
| Figure 6. | 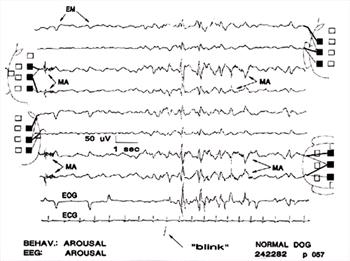
Eye movement artifacts are present in all channels (EM). Muscle artifact (MA) in channels 3, 4, 7, 8; the CV electrode, which was used in all 4 of those channels, recorded it. Large deflections caused by blinking ("blink") appeared in all channels. These deflections are superficially similar to some types of paroxysmal discharges (PD). Behavior and BGR consistent with full arousal. |
|
| |
Respiratory artifact consists of slow waves that are synchronized with movements of the body and head associated with inspiration and/or expiration, usually when the dog is panting (Figure 7). While usually readily identified during EEG interpretation, notes made during recording are helpful in recognizing respiratory artifact or, conversely, in verifying that rhythmic slow activity in the recording is genuine EEG and not artifact (Figure 7). Head movements, swallowing, and movements of the mandibles will introduce artifacts also (Figure 8).
Click on the image to see a larger view
| Figure 7. | 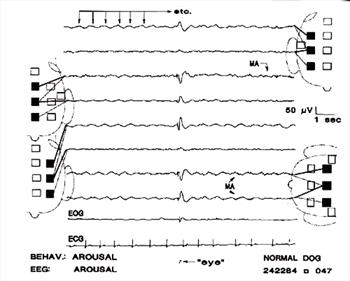
Eye movement /blinking artifact; respiratory movement artifacts; muscle artifacts. The high amplitude event in channels 3,4,5, and 6,7,8, is an artifact associated with eye movement, as noted by the electroencephalographer. The initial, very fast portion, is muscle artifact; the slower part that follows may have resulted from movement of the globe and/or the eyelid. Respiratory movements caused the rhythmical slow waves marked by the arrows in channel 1 and evident in other channels. Very low amplitude muscle artifact in channels 3, 4, 7, 8. Note the "instrumental phase reversal" in channels 3, 4 and 7, 8. |
|
| |
| Figure 8. | 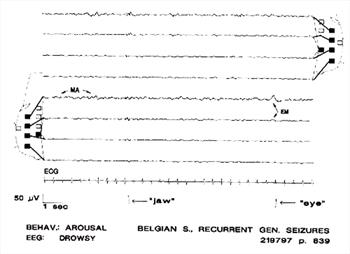
Artifacts caused by movement of the mandibles ("jaw"), eye movements (EM, "eye"); low-amplitude fast activity in channel 5 caused by muscle (MA). Behavior and BGR consistent with full arousal. Note also the lower amplitudes in channels 3,4, 7, 8, where the exploring electrodes are close to the reference electrode. |
|
| |
Eye movements cause relatively slow waves in the EEG by volume conduction of the electro-oculogram (EOG) to the EEG electrodes. Recording the EOG helps in verifying eye movement artifacts. Surprisingly, the amplitude of eye-movement artifacts in the EEG channels can be rather high, sometimes exceeding the amplitude recorded by the EOG electrodes (Figure 5, 6). Some of these artifacts can be confused with PD if the movements are not observed or the EOG is not recorded (Figure 7). Eye movements often are accompanied by eyelid movements (e.g., blinking) and/or with movements of the scalp, either of which may be associated with muscle potentials and/or electrode/wire movement artifacts.
Electrocardiographic Artifacts
Recording the ECG in one channel of the polygraph is helpful in recognizing ECG artifact in the EEG, where the QRS complex can be mistaken for a spike or where chance occurrence of a QRS complex at the time of an EEG slow wave might be mistaken for a PD (spike-and-wave complex) (Figure 9, 10).
Click on the image to see a larger view
| Figure 9. | 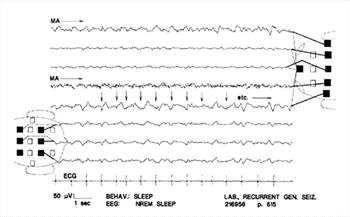
ECG artifact. Only a few examples are marked (arrows); many others are evident. Note their constant appearance and synchrony with the ECG. This typical artifact is readily recognizable even if the ECG is not recorded. Muscle artifact is continuous in channel 4 and intermittent in channel 1. |
|
| |
| Figure 10. | 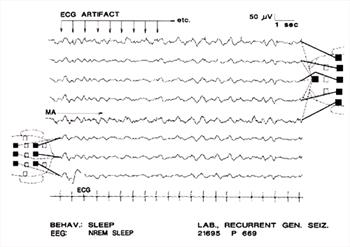
Here, ECG artifact is mingled with slow waves (arrows); the result should not be mistaken for spike-wave complexes. Note that the ECG artifact is not "time-locked" to the slow wave, as is the spike of a spike-wave complex. There is continuous muscle artifact in channel 4 and intermittently in channel 1. The very high amplitude, slow BGR in channels 1 and 5 apparently were generated around a focus in the rostral region of the right hemisphere. The dog's behavior and the background rhythms suggest it was in slow-wave sleep; however the focal BGR abnormality may interfere with accurate identification of the state of vigilance. Note combined use of a bipolar and a referential montage. |
|
| |
The Normal electroencephalogram
Normal Background Rhythms
Background rhythms (BGR) are the ongoing, continuous EEG activity which forms the setting against which transient events occur.20 Background rhythms in normal animals vary significantly with changes in state of sleep or arousal.26 To make accurate EEG interpretations these "states of vigilance" must be recognized. Age differences exist also. The BGR of puppies are decidedly different from those of mature animals, reaching the mature forms at 5 months of age (occasionally up to 10 months in our personal experience).30,31 Importantly, certain transient events are normal during some sleep stages and must be recognized to avoid mistaking them for PD.
When sedative drugs are used, dogs undergo readily recognizable levels of all stages of normal consciousness: full arousal; alpha rhythm; drowsiness; non-REM sleep; rapid eye movement (REM) sleep.26 (Non-REM sleep has been referred to also as "slow-wave sleep").
Full Arousal
Full arousal is recognizable by alert behavior, the animal responding to environmental disturbances, making searching movements with the head, eyes or ears, or even by attempting to arise from the recumbent state usually assumed during recording. BGR during full arousal are usually of very low amplitude (< 20 mV), with higher frequencies (15-25 Hz) predominating (Figure 11). Muscle artifact is common during arousal, often obscuring one or more channels of EEG (Figure 5, 6).
Click on the image to see a larger view
| Figure 11. | 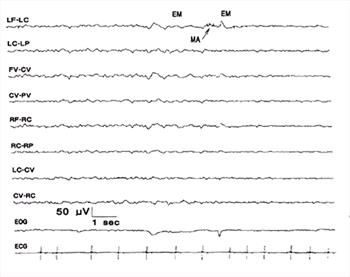
Arousal and non-REM sleep. At left, the BGR are consistent with SWS. During the 2-3 sec period, beginning with eye movements and some muscle artifact, there is a transition to full arousal with the predominantly low amplitude, faster BGR of arousal evident at the right side of the figure. |
|
| |
Alpha Rhythm
The alpha rhythm of dogs was reported to be similar to the human alpha rhythm. It was recordable if the animal was held in a quiet ambience and closed its eyes. Typically, a period of stable alpha rhythm had a duration of about 8-15 sec, after which it was replaced by higher frequencies when the animal opened its eyes or was aroused, or by lower frequencies as the animal became sleepy.32-34 In our experience, dogs usually change from full arousal to behavior and EEG rhythms that resemble the state described by Ruckebusch as "drowsiness".35 Although BGR during periods of apparent drowsiness sometimes resemble the canine alpha rhythms described earlier32-34 (e.g., Figure 8, 12) we cannot verify this because we have not routinely tested dogs during these periods for EEG reactivity to stimulation, a necessary criterion for identifying the alpha rhythm.
Click on the image to see a larger view
| Figure 12. | 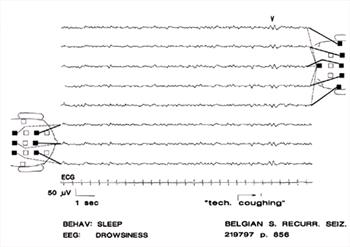
Drowsiness. Background rhythms are between those of arousal and non-REM sleep. Note V-wave (V) as a response to disturbance ("tech. coughing"). |
|
| |
Drowsiness
During drowsiness, dogs are recumbent with their eyes partially or completely closed; at this time they can be quite readily aroused by minimal stimulation or small disturbances in the environment. The BGR consist of predominant 6-8 or 6-10 Hz waves of 10-20 FV amplitude, with superimposed random slower and higher frequencies (Figure 12). If undisturbed during drowsiness, most sedated dogs soon enter non-REM sleep.
Non-REM Sleep
During non-REM sleep, dogs are recumbent and apparently unaware of environmental disturbances; their eyes are closed or nearly closed, and stronger stimuli are needed to arouse them than during drowsiness. BGR at this time are predominantly 2-4.
Hz with lower amplitude superimposed activity, predominantly in the 6-10 Hz range. Amplitudes during non-REM sleep vary from 15-20 FV up to 100 FV; the wide variation is due at least in part to variations in inter-electrode distances associated with body size (Figure 11, 13). Stages of light and deep non-REM sleep are often recognizable by the higher amplitudes and lower frequencies during deep non-REM sleep.
Click on the image to see a larger view
| Figure 13. | 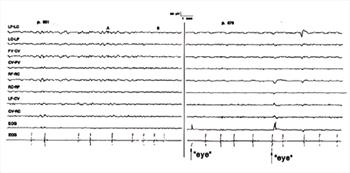
Transition from non-REM sleep to rapid eye movement (REM) sleep. The elapsed time between the beginning of the left panel and the beginning of the right panel was 5.2 min. Transition occurred during the period between A and B in the left panel when BGR changed to a lower amplitude and higher frequency. REM began at the onset of the left panel. |
|
| |
REM Sleep
During REM sleep, dogs are recumbent with their eyes partially or completely closed. With the onset of REM sleep, BGR change rapidly, losing amplitude and increasing in frequency so they resemble those of arousal. About 5 to 10 minutes after REM sleep begins, the eye movements begin; very often, these are accompanied by movements of the feet, mouth or other body parts and even by vocalization (Figure 13, 15).
Duration of Levels of Consciousness
Under the recording conditions used in the UCD-VMTH laboratory, drowsiness and non-REM sleep usually begin less than 10 minutes after recording begins, thus EEG observations during arousal may be rather limited. Likewise, dogs often enter REM sleep 5 to 10 minutes after non-REM sleep begins, a briefer time than reported.26 This may be an effect of the sedation used. Also, in epileptic patients, which constitute the majority of our EEG patients, these differences in sleep latencies may be caused by the same mechanism which causes short latency of non-REM sleep and short, "fragmented" sleep-wake cycles in epileptic beagles.36
Normal EEG Transient Events
Spindles, K-complexes and V waves are normal EEG transients that are of highest amplitude on the midline but are usually quite evident in electrodes located laterally, where they are symmetrical in amplitude and frequency. Distinct asymmetries, or absences on one side with presence on the other, are indicative of abnormality. The 4-6 Hz Bursts described below are, in the authors' opinions, normal and show the same characteristics as other normal transients.
Spindles
Sleep spindles are repetitive sinusoidal waves. They begin at somewhat lower amplitude, increase and then decrease in amplitude thus giving the outline of the event a spindle shape. Spindles are recorded often during non-REM sleep (Figure 14). Sleep spindles are bilaterally symmetrical and of highest amplitude in midline derivations but are visible in lateral derivations as well. Spindles are recorded from some dogs during REM sleep; possibly this is a drug effect (Figure 15).
Click on the image to see a larger view
| Figure 14. | 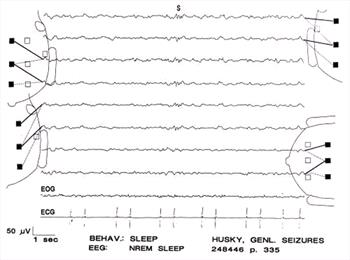
Sleep spindles (S) during non-REM sleep. |
|
| |
| Figure 15. | 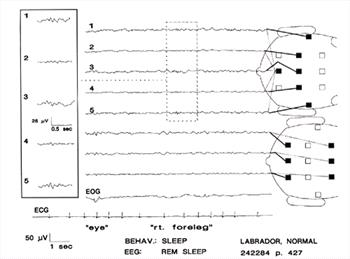
Sleep spindles recorded during REM sleep. Eye movement and right foreleg movement. Very slow deflections in EOG channel are probably artifacts associated with the leg movements. Channels 1 through 5 are shown enlarged in the inset. |
|
| |
K-complexes
A K-complex consists of a spindle associated with a slow wave; the spindle may appear before, during or after the slow wave, thus there is considerable variation in the appearance of K-complexes.20,37 K-complexes occur during non-REM sleep. They are of highest amplitude and most clearly developed on the midline, but are visible in lateral derivations as well (Figure 16).
Click on the image to see a larger view
| Figure 16. | 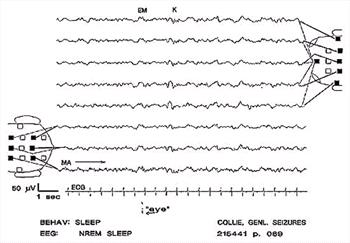
K-complex (K). The slow wave may occur before, during or after the spindle. In this instance, the slow wave occurs first. Muscle artifact in channel 8. |
|
| |
Vertex Waves
Vertex sharp transients (V waves) are responses to stimulation, usually during drowsiness or sleep. Most often in human patients, the stimulus is auditory, although other stimuli can be effective.19 They can be recorded from dogs occasionally during drowsiness (Figure 12). V-waves can be differentiated from PD by the fact they do not have spike components, occur only during drowsiness, and are always of highest amplitude on the midline and symmetrically distributed.
Four to Six per Second Bursts
In some dogs, rhythmic, 0.5 to 1 sec bursts of 4-6 Hz sinusoidal waves are recorded about the time of the transition from drowsiness to non-REM sleep. These bursts, which are symmetrically distributed with highest amplitude on the midline, are frequently associated with eye movements which occur 1-3 sec after the EEG event. In some cases the frequency of these bursts increases from onset to termination (Figure 17). The nature of these discharges is unknown; they have been recorded from normal dogs as well as from clinical patients, therefore cannot be considered abnormal. Similar, but not identical, transients are recorded from children.37
Click on the image to see a larger view
| Figure 17. | 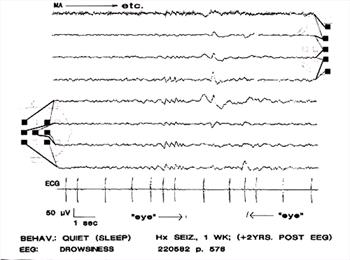
Rhythmic, 4-6 Hz sinusoidal waves (A). In this case the associated eye movements occurred 1 and 3 seconds after the sinusoidal waves. The waves are of lower amplitude on the right side. Muscle artifact in channel 1. |
|
| |
Responses to Photic Stimulation
Photic stimulation (PS), using a flashing lamp held before the eyes, is a common activating method used in recording human EEG. In our experience, photic stimulation causes changes in background rhythms in about 25% of normal dogs. These consist of the appearance of symmetrical sinusoidal BGR at the same frequency as the stimulation. The rhythms appear at or within a few seconds of the onset of stimulation and disappear immediately with its cessation. Stimulus frequencies of 2-10 Hz are most effective in eliciting this so-called "photic driving" (Figure 18).4,17 It is reasonable to question whether these responses are in fact the electroretinogram (ERG) or the visual evoked response (VEP). However these are single responses with amplitudes of 15-50 microvolts, which exceed that of the electroretinogram and the visual evoked response, even when the latter are recorded using signal averaging.37 Photic driving is considered to be a physiological response in human patients;25 it seems likely this is true for canine photic driving also.
Click on the image to see a larger view
| Figure 18. | 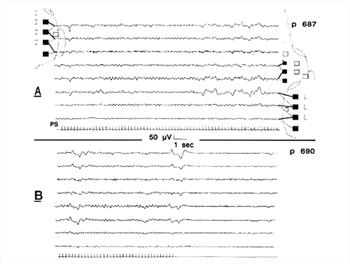
"Photic driving" in response to flickering light stimulation (PS: stimulus event marker in lowermost channel). Note onset and end of change in BGR rhythms concurrent with onset and end of stimulation; this is normal. High amplitude irregular waves at right of upper panel were movement artifacts; photic stimulation often disturbs the patient, resulting in movements. After stimulation, BGR were those of full arousal. Low amplitude muscle artifact throughout both panels in channel 3. |
|
| |
References
1. Brass, VW. über elektroencephalographische Untersuchungen beim Hund. Deutsche Tierärztliche Wochenschrift, 1959;66:242-246.
2. Croft PG. The EEG as an aid to diagnosis of nervous diseases in the dog and cat. J Small Anim Pract 1962;3:205-213.
3. Fox MW. Postnatal EEG in dog. J Small Anim Prac 1967;8:7.
4. Holliday TA, Cunningham JG, Gutnick MJ. Comparative clinical and electroencephalographic studies of canine epilepsy. Epilepsia 1970;11:281-292.
5. Klemm WR. Electroencephalography in the diagnosis of epilepsy. Probl Vet Med 1989;1(4):535-557.
6. Redding RW, Knecht, CE. Atlas of Electroencephalogrpahy in the Dog and Cat. Praeger, New York, 1984.
7. Steiss JE, Cox NR Knecht CD. Electroencephalographic and histopathologic correlations in eight dogs with intracranial mass lesions. Am J Vet Res 1990 Aug;51(8):1286-91.
8. Venturoli, M. L'elettroencefalogramma normale del cane. La Clinica Veterinaria 1962;85:525-544.
9. Muzzi D, Cucchiara RF. Brain monitoring with the electroencephalogram. Semin Anesth 1989;VIII:93-101.
10. Prior PF. EEG monitoring and evoked potentials in brain ischaemia. Br J Anaesth 1985;57:63-81.
11. Stone JL Ghaly RF Hughes JR. Electroencephalography in acute head injury. J Clin Neurophysiol 1988 Apr;5(2):125-33 .
12. Speckmann E.-J and Caspers H (eds). Origin of Cerebral Field Potentials. Thieme, Stuttgart, 1979.
13. Speckmann E-J, Elger C E. Introduction to the neurophysiological basis of the EEG and DC potentials. In: Niedermeyer E and Lopes da Silva F (eds), Electroencephalography. Basic Principles, Clinical Applications and Related Fields. Urban and Schwarzenberg, Baltimore, 1987.
14. Woodbury JO. Action potential properties of excitable membranes. In: Physiology and Biophysics. Ruch TC and Patton D (Eds). WB Saunders and Company, Philadelphia, 1966.
15. Caspars H Speckmann E.-J Lehmankuehler A. Electrogenesis of slow potentials of the brain. In: self Regulation of the Brain and Behavior. Elbert T Rockstroh B Luetzenberger W Birbaumer N (Eds). Springer New York 1984.
16. Holmes O. Howard L. Mass and unitary activity in and around the primary somatosensory area in cats. J Physiol (Lond) 1971;217:45-46.
17. Redman HC Wilson GL Hogan JE. Effect of chlorpromazine combined with intermittent light stimulation on the electroencephalogram and clinical response of the Beagle dog. Am J Vet Res 1973 Jul;34(7):929-36.
Klemm WR and Hall CL. Electroencephalographic "seizures" in anesthetized dogs with neurologic diseases. J Am Vet Med Assoc 1970;157:1640-1655.
18. Joas TA, Stevens WC, Eger EI Electroencephalographic seizure activity in dogs during anaesthesia Br J Anaesth 1971;43:739-745.
19. Cobb W A (ed). Recommendations for the practice of clinical neurophsyiology. International Federation of Societies for Electroencephalography and Clinical Neurophysiology. Elsevier Amsterdam, New York, Oxford, 1983.
20. Knott JR Electrode montages revisited: How to tell up from down. Am J Electroencephalogr Technol 1969;9:33-45.
21. Knott JR. Further thoughts on polarity, montages, and localization. J Clin Neurophysiol 1985;2:63-75.
22. Reilly E L. EEG recording and operation of the apparatus. in: Electroencephalography. Basic Principles, Clinical Applications and Related Fields. Niedermeyer E and Lopes da Silva F eds. Urban and Schwarzenberg, Baltimore, 1987.
23. Bente D and Itil, T. Zur Wirkung des Phenothiazinkoerpers Megaphen auf das mensliche Hirnstrombild. Arzneimitt Forsch 1954;4:418-423.
24. Takahashi T. Activation methods in: Electroencephalography Basic Principles, Clinical Applications and Related Fields. Niedermeyer E and Lopes da Silva F eds. Urban and Schwarzenberg, Baltimore, 1987.
25. Foutz AS, Mitler MM, Dement WC. Narcolepsy. Vet Clin North Am [Small Anim Pract]1980;10:65-80.
26. Lopes da Silva F. EEG analysis: theory and practice In: Electroencephalography Basic Principles, Clinical Applications and Related Fields. Niedermeyer E and Lopes da Silva F eds. Urban and Schwarzenberg, Baltimore, 1987.
27. Lopes da Silva F. Computer-assisted EEG diagnosis: Pattern recognition in EEG analysis, feature extraction and classification. In: Electroencephalography Basic Principles, Clinical Applications and Related Fields. Niedermeyer E and Lopes da Silva F eds. Urban and Schwarzenberg, Baltimore, 1987.
28. Klemm WR. Animal Electroencephalography. Academic Press, New York 1969.
29. Pampiglione G. Development of Cerebral Function in the Dog. Butterworths, London, 1963
30. Tourai K Senba H, Sasaki N, et al. Developmental EEG of the beagle dog under xylazine sedation. Japn J Vet Sci 1985;47:459-463.
31. Lopes da Silva F, van Lierop HMT, Schrijer CF and Storm van Leeuwen W. Organization of thalamic and cortical alpha rhythms: spectra and coherences. Electroenceph Clin Neurophysiol 1973;35:627-639.
32. Lopes da Silva FH and Storm van Leeuwen W. The cortical source of the alpha rhythm. Neuroscience Letters 1977;6:237-241.
33. Lopes da Silva FH, Storm van Leeuwen W. The cortical alpha rhythm in dog: the depth and surface profile of phase. In: Brazier MAB and Petsche H. (Eds). Architectonics of the cerebral cortex. New York:Raven Press, 1978;319-333.
34. Ruckebusch Y. EEG normal du chien. Rev Méd Vét 1963;114:119.
35. Wauquier A, Van den Broeck WA, Edmonds HL Jr. Sleep in epileptic beagles and antiepileptics. Funct Neurol 1986;1:53-61.
36. Niedermeyer E Sleep and EEG. In: Niedermeyer E and Lopes da Silva F. Electroencephalography. Basic principles, clinical applications and related fields. Urban and Schwarzenbeck, Baltimore 1987; Chapter 10, 119-132.
37. Sims MH, Laratta LJ, Bubb WJ and Morgan RV. Waveform analysis and reproducibility of visual evoked potentials in dogs. Amer J Vet Res 1989; 50:1823-1828.